Linking to GEOS 3.11.0, GDAL 3.5.3, PROJ 9.1.0; sf_use_s2() is TRUEThe Pew Global Attitude Survey (PGAS)
The data used in our analysis has been extracted from the website of the Pew Research Center where they can be freely downloaded. They are more precisely extraction from the Pew Global Attitude Survey from 2002 to present (2023).
After briefly presenting the source, we will explain the different steps of harmonization that we have realized to obtain a continuous time series of international opinion.
The Pew Global Attitude Survey (PGAS)
The PGAS is not exactly a pure scientific survey as the World Value Survey or the European Value Survey. It is enhanced in a long history as explained by a blog published on th website “Knowledge for Policy” of EU some years ago.
The Pew Global Attitudes Project was originally conceived with two primary objectives: to gauge attitudes in every region toward globalization; trade and an increasingly connected world; and to measure changes in attitudes toward democracy and other key issues among some of the European populations surveyed in the 13-nation 1991 benchmark survey; the Pulse of Europe (also directed by Dr. Albright and Mr. Kohut). After the terrorist attacks on September 11; 2001; the scope of the project was broadened to measure attitudes about terrorism; the intersection between the Islamic faith and public policy in countries with significant Muslim populations; and to probe attitudes toward the United States more deeply in all countries. Recent Global Attitudes surveys have gauged worldwide opinion about international news developments; including the war in Iraq. Over time; the project has surveyed more than 90000 people in 50 countries.
Source : European Union, Knowledge for policy, 2022
The description presented by EU websiste is not accurate because, as we will see in our description of data, the coverage is today much more important than 90 000 people in 50 countries. And the post on the blog of EU has also forgotten to mention that one of the initial purposes of the Pew Charitable Trust, before 2001, was to follow not only the attitude of people toward democracy but also toward religion in the world.
We will complete this description later, but it is sufficient to remember that the PGAS is a political barometer of world opinion elaborated in the US after the shock of September 11, 2001.
Five indicators for long time series
From 2002 to 2023, 22 waves of the PGAS has been realized and the majority of questions has changed over time or have been formulated in a different way, which make comparisons difficult. We have therefore selected a very limited number of 5 questions which has kept exactly the same wording over time and has been asked in different waves.
Sample design by country and year
The time period (wav), the country investigated in the survey (sta) and the sex or age of the respondent are classical dimension that are used to frame the survey and choose the samples. Combined with a variable list of other framing indicators (education, urban-rural, income, …) they make possible to correct the samples by a weighting criteria (weight) which insure an adequation with the full population of the countries. In the majority of countries and time period, the sample size was about 1000 people, but can be sometimes lower (min = 500) or higher (max 3000). In developping countries, the survey was generally realized by face-to-face interveiw but in most developped countries (and also through time) most surveys has been realized by phone or eventually on the internet. All details on the country specific methodology by year are available and provide very usefull information on the technical and political difficulties of realization of the survey and the related margin of errors.
Definition of indicators
tail(don,5) wav sta wgt sex age rel opi_USA
617341 2023 ZAF 1.8703222 Male 22 Very important Very unfavorable
617342 2023 ZAF 1.0502763 Male 24 Somewhat important Somewhat favorable
617343 2023 ZAF 0.3254254 Male 39 Very important Very unfavorable
617344 2023 ZAF 2.4937630 Male 28 Very important DK
617345 2023 ZAF 0.7725435 Female 24 Very important Somewhat favorable
opi_CHN opi_RUS opi_UN
617341 Very favorable Very favorable Very favorable
617342 Very favorable Somewhat favorable Somewhat favorable
617343 Very unfavorable Very unfavorable Very unfavorable
617344 Very unfavorable Very unfavorable DK
617345 Somewhat favorable Somewhat favorable Somewhat favorable
opi_EU opi_IRN opi_DEU opi_FRA opi_JPN opi_IND
617341 Very favorable <NA> <NA> <NA> <NA> Very favorable
617342 Somewhat favorable <NA> <NA> <NA> <NA> Somewhat favorable
617343 Very unfavorable <NA> <NA> <NA> <NA> Very unfavorable
617344 Very unfavorable <NA> <NA> <NA> <NA> Somewhat favorable
617345 Somewhat favorable <NA> <NA> <NA> <NA> Somewhat favorable
opi_TWN opi_BRA
617341 Very favorable <NA>
617342 Somewhat favorable <NA>
617343 DK <NA>
617344 DK <NA>
617345 Somewhat favorable <NA>wav : the year where the survey has been realized. The precise period of time is indicated in the country specific methodology by year. The majority of surveys has been realized in Spring.
sta : the state where the survey was realized. We use here the ISO3 code as reference in order to make more easy the cartography or the linkage with other data sources.
wgt : the weight of observation that should be used to balance bias in the sample and obtain better estimates of values for each country and each year. This information was lost for some countries in 2002 and was therefore made equal to 1.
sex : the sex of the person that answered. The Pew Research Center does not offer alternative answers for non binary people. It is generally not asked but directly recorded by the person in charge of the inquiries.

- rel : the question about the importance of religion in the life of the respondent take the form of a scale with four ordered levels. The formulation has remained strictly the same over time which insure good quality of comparison. This question has been generally asked in all countries until 2015. But they were later some exceptions, in particular in countries of Europe like France, Germany or UK.
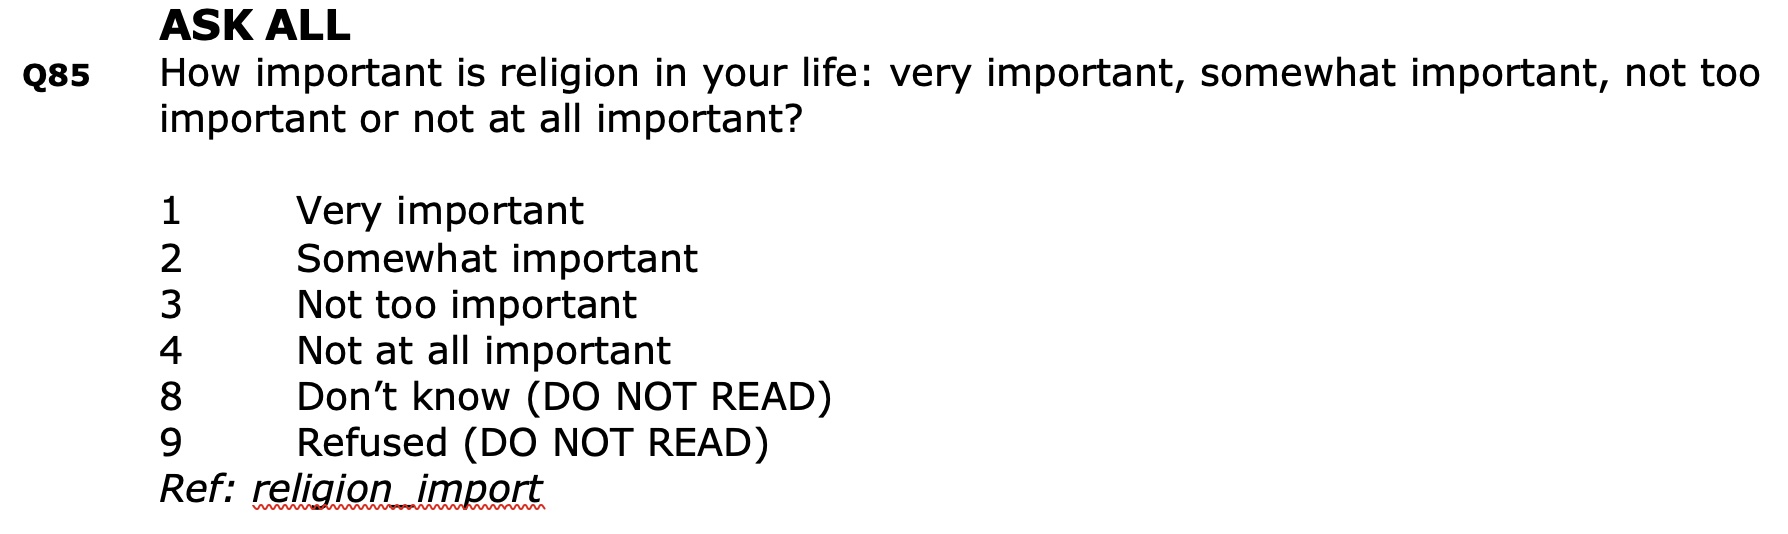
- opi_xxx : this central question is much more complex than the previous one because it is a battery of questions about different countries but also sometimes different people, different organisation or even different religions. The general rule is to start by the question about the opinion of USA (and eventually “Americans”) and then to propose the other items in a random order. It suggest that USA/Americans are used as a reference around which we can measure positive or negative deviations. Another important complication with this question is the fact that some items are proposed to all countries under investigation but other are only asked in selected countries. In this case, we are oblige to admit that the comparison will be biased because the full list of items has a systemic influence on the results about each item. As an example, consider the formulation of the question in the waves of 2009 an 2019.
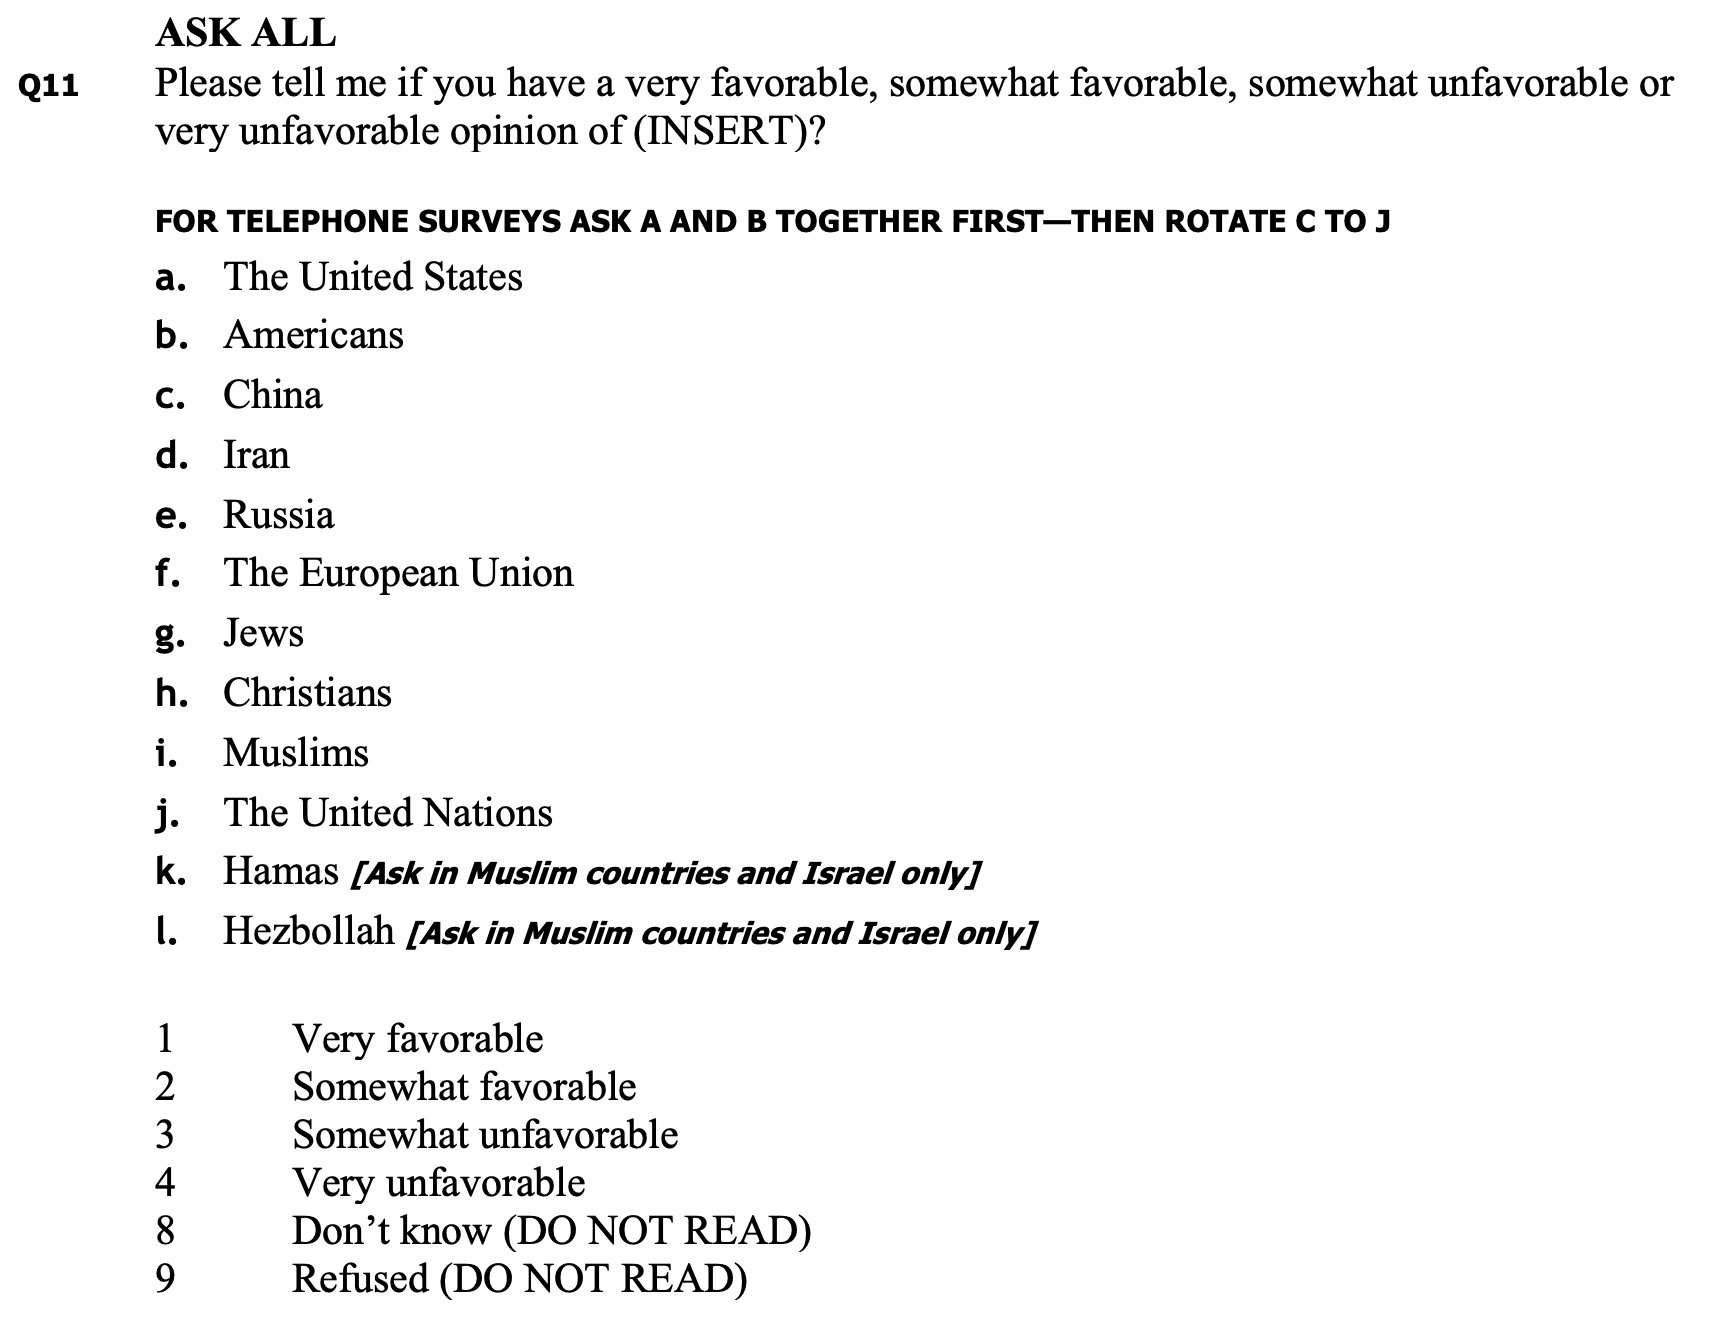
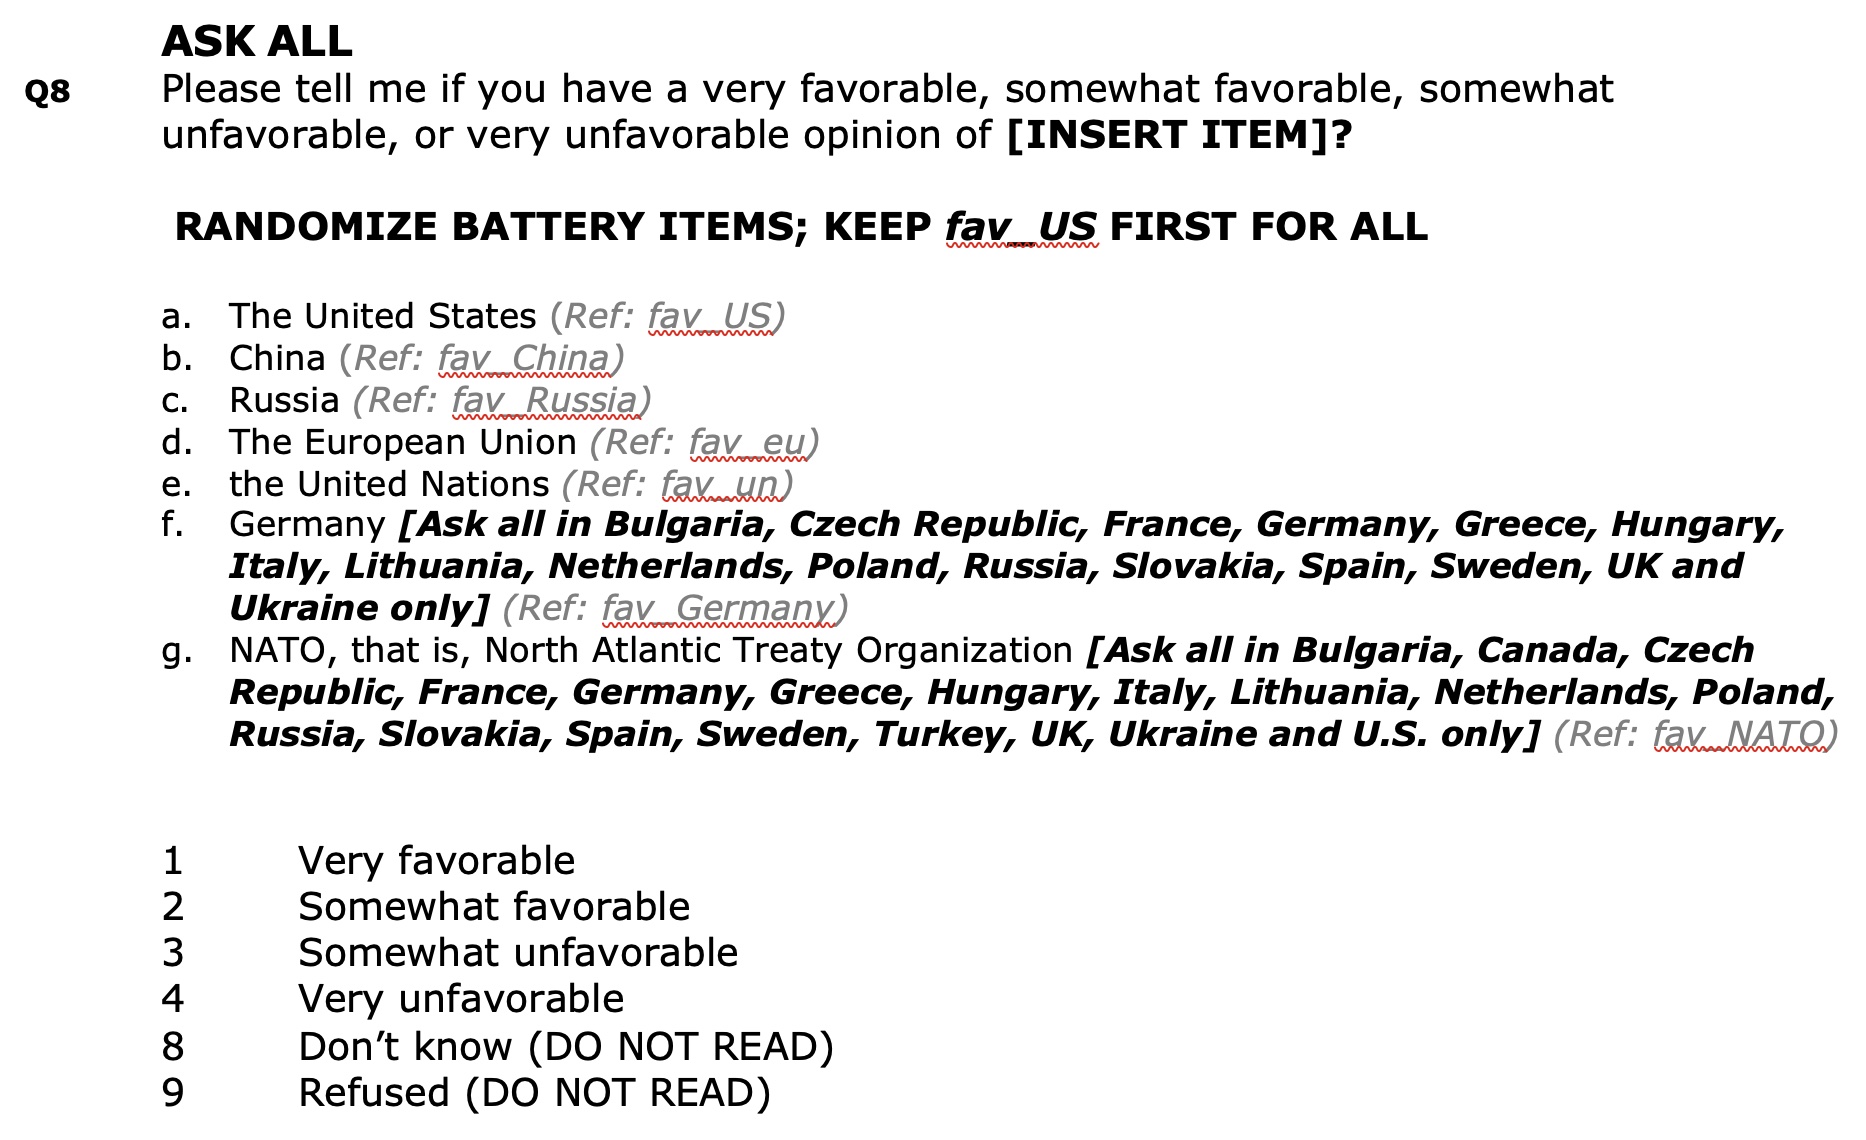
The wording of the question is the same and the ordinal scale at four level is equivalent, but the fact that the list of items has changed introduce a difficulty in the analysis of the results, even if we decide to focus only the items that are present in the two waves (USA, China, Russia, EU, UN). In 2009, the evaluation is influenced by questions about religions which is not the case in 2019. Even if we consider a single year like 2019, the fact that NATO or Germany are added to the items in Europe but not in other countries of the world will probably modify the answers about Russia.
Considering the difficulties induced by the halo effect, we have decided to limit our selection of answers to the items that (1) has been asked to all countries and (2) the item that are about states or regional organization but not about peoples or religions. We will therefore not keep the answers about Germany and NATO in 2019 and no more consider the answers about Americans, Jews, Christians or Muslims in 2019.
Availability of indicators by waves
The table below indicates for each question the waves where it has been used.
| 02 | 03 | 04 | 05 | 06 | 07 | 08 | 09 | 10 | 11 | 12 | 13 | 14 | 15 | 16 | 17 | 18 | 19 | 20 | 21 | 22 | 23 | |
|---|---|---|---|---|---|---|---|---|---|---|---|---|---|---|---|---|---|---|---|---|---|---|
| sta | 1 | 1 | 1 | 1 | 1 | 1 | 1 | 1 | 1 | 1 | 1 | 1 | 1 | 1 | 1 | 1 | 1 | 1 | 1 | 1 | 1 | 1 |
| sex | 1 | 1 | 1 | 1 | 1 | 1 | 1 | 1 | 1 | 1 | 1 | 1 | 1 | 1 | 1 | 1 | 1 | 1 | 1 | 1 | 1 | 1 |
| age | 1 | 1 | 1 | 1 | 1 | 1 | 1 | 1 | 1 | 1 | 1 | 1 | 1 | 1 | 1 | 1 | 1 | 1 | 1 | 1 | 1 | 1 |
| rel | 0 | 0 | 0 | 1 | 0 | 1 | 1 | 1 | 1 | 1 | 1 | 1 | 0 | 1 | 1 | 1 | 1 | 1 | 1 | 1 | 1 | 1 |
| opi_USA | 1 | 1 | 1 | 1 | 1 | 1 | 1 | 1 | 1 | 1 | 1 | 1 | 1 | 1 | 1 | 1 | 1 | 1 | 1 | 1 | 1 | 1 |
| opi_CHN | 0 | 0 | 0 | 1 | 1 | 1 | 1 | 1 | 1 | 1 | 1 | 1 | 1 | 1 | 1 | 1 | 1 | 1 | 1 | 1 | 1 | 1 |
| opi_RUS | 0 | 0 | 0 | 0 | 0 | 1 | 0 | 1 | 1 | 1 | 1 | 1 | 1 | 1 | 0 | 1 | 1 | 1 | 1 | 0 | 1 | 1 |
| opi_UN | 0 | 0 | 1 | 0 | 1 | 1 | 0 | 1 | 0 | 1 | 1 | 1 | 0 | 0 | 0 | 0 | 0 | 1 | 1 | 1 | 1 | 1 |
| opi_EU | 0 | 0 | 1 | 0 | 0 | 1 | 0 | 1 | 1 | 1 | 1 | 1 | 1 | 0 | 0 | 0 | 0 | 1 | 1 | 1 | 1 | 1 |
| opi_IRN | 0 | 0 | 0 | 0 | 1 | 1 | 1 | 1 | 1 | 1 | 1 | 1 | 1 | 1 | 0 | 0 | 0 | 0 | 1 | 0 | 0 | 0 |
| opi_DEU | 0 | 0 | 0 | 1 | 1 | 0 | 0 | 0 | 0 | 0 | 0 | 0 | 0 | 0 | 0 | 0 | 0 | 0 | 0 | 1 | 0 | 0 |
| opi_FRA | 0 | 0 | 0 | 1 | 1 | 0 | 0 | 0 | 0 | 0 | 0 | 0 | 0 | 0 | 0 | 0 | 0 | 0 | 0 | 0 | 0 | 0 |
| opi_JPN | 0 | 0 | 0 | 1 | 1 | 0 | 1 | 0 | 0 | 0 | 0 | 0 | 0 | 0 | 0 | 0 | 0 | 0 | 0 | 0 | 0 | 0 |
| opi_IND | 0 | 0 | 0 | 0 | 0 | 0 | 0 | 0 | 0 | 0 | 0 | 0 | 0 | 0 | 0 | 0 | 0 | 0 | 0 | 0 | 0 | 1 |
| opi_TWN | 0 | 0 | 0 | 0 | 0 | 0 | 0 | 0 | 0 | 0 | 0 | 0 | 0 | 0 | 0 | 0 | 0 | 0 | 0 | 0 | 0 | 1 |
| opi_BRA | 0 | 0 | 0 | 0 | 0 | 0 | 0 | 0 | 0 | 0 | 0 | 0 | 1 | 0 | 0 | 0 | 0 | 0 | 0 | 0 | 0 | 0 |
Spatial coverage
There is a great variability in the list and number of states that was investigated by the PGAS. Generally speaking the number of states investigated was more important for the odd-numbered years with a larger extension toward developping countries from the South. The even-numberd years was generally characterised by a lower number of countries and a focus on rich countries from the North. But they are many exceptions to this rule.
Country covered by the survey
| 02 | 03 | 04 | 05 | 06 | 07 | 08 | 09 | 10 | 11 | 12 | 13 | 14 | 15 | 16 | 17 | 18 | 19 | 20 | 21 | 22 | 23 | Sum | |
|---|---|---|---|---|---|---|---|---|---|---|---|---|---|---|---|---|---|---|---|---|---|---|---|
| Sum | 44 | 21 | 9 | 17 | 15 | 47 | 24 | 25 | 22 | 23 | 21 | 39 | 44 | 40 | 19 | 38 | 27 | 34 | 14 | 16 | 18 | 23 | 580 |
| DEU | 1 | 1 | 1 | 1 | 1 | 1 | 1 | 1 | 1 | 1 | 1 | 1 | 1 | 1 | 1 | 1 | 1 | 1 | 1 | 1 | 1 | 1 | 22 |
| FRA | 1 | 1 | 1 | 1 | 1 | 1 | 1 | 1 | 1 | 1 | 1 | 1 | 1 | 1 | 1 | 1 | 1 | 1 | 1 | 1 | 1 | 1 | 22 |
| GBR | 1 | 1 | 1 | 1 | 1 | 1 | 1 | 1 | 1 | 1 | 1 | 1 | 1 | 1 | 1 | 1 | 1 | 1 | 1 | 1 | 1 | 1 | 22 |
| ESP | 0 | 1 | 0 | 1 | 1 | 1 | 1 | 1 | 1 | 1 | 1 | 1 | 1 | 1 | 1 | 1 | 1 | 1 | 1 | 1 | 1 | 1 | 20 |
| JPN | 1 | 0 | 0 | 0 | 1 | 1 | 1 | 1 | 1 | 1 | 1 | 1 | 1 | 1 | 1 | 1 | 1 | 1 | 1 | 1 | 1 | 1 | 19 |
| USA | 1 | 1 | 1 | 1 | 1 | 1 | 1 | 1 | 1 | 1 | 1 | 1 | 1 | 1 | 1 | 1 | 1 | 1 | 1 | 0 | 0 | 0 | 19 |
| POL | 1 | 0 | 0 | 1 | 0 | 1 | 1 | 1 | 1 | 1 | 1 | 1 | 1 | 1 | 1 | 1 | 1 | 1 | 0 | 0 | 1 | 1 | 17 |
| RUS | 1 | 1 | 1 | 1 | 1 | 1 | 1 | 1 | 1 | 1 | 1 | 1 | 1 | 1 | 0 | 1 | 1 | 1 | 0 | 0 | 0 | 0 | 17 |
| IDN | 1 | 1 | 0 | 1 | 1 | 1 | 1 | 1 | 1 | 1 | 0 | 1 | 1 | 1 | 0 | 1 | 1 | 1 | 0 | 0 | 0 | 1 | 16 |
| IND | 1 | 0 | 0 | 1 | 1 | 1 | 1 | 1 | 1 | 1 | 1 | 0 | 1 | 1 | 1 | 1 | 1 | 1 | 0 | 0 | 0 | 1 | 16 |
| KOR | 1 | 1 | 0 | 0 | 0 | 1 | 1 | 1 | 1 | 0 | 0 | 1 | 1 | 1 | 0 | 1 | 1 | 1 | 1 | 1 | 1 | 1 | 16 |
| TUR | 1 | 1 | 1 | 1 | 1 | 1 | 1 | 1 | 1 | 1 | 1 | 1 | 1 | 1 | 0 | 1 | 0 | 1 | 0 | 0 | 0 | 0 | 16 |
| BRA | 1 | 1 | 0 | 0 | 0 | 1 | 1 | 1 | 1 | 1 | 1 | 1 | 1 | 1 | 0 | 1 | 1 | 1 | 0 | 0 | 0 | 1 | 15 |
| CAN | 1 | 1 | 0 | 1 | 0 | 1 | 0 | 1 | 0 | 0 | 0 | 1 | 0 | 1 | 1 | 1 | 1 | 1 | 1 | 1 | 1 | 1 | 15 |
| ITA | 1 | 1 | 0 | 0 | 0 | 1 | 0 | 0 | 0 | 0 | 1 | 1 | 1 | 1 | 1 | 1 | 1 | 1 | 1 | 1 | 1 | 1 | 15 |
| JOR | 1 | 1 | 1 | 1 | 1 | 1 | 1 | 1 | 1 | 1 | 1 | 1 | 1 | 1 | 0 | 1 | 0 | 0 | 0 | 0 | 0 | 0 | 15 |
| NGA | 1 | 1 | 0 | 0 | 1 | 1 | 1 | 1 | 1 | 0 | 0 | 1 | 1 | 1 | 1 | 1 | 1 | 1 | 0 | 0 | 0 | 1 | 15 |
| LBN | 1 | 1 | 0 | 1 | 0 | 1 | 1 | 1 | 1 | 1 | 1 | 1 | 1 | 1 | 0 | 1 | 0 | 1 | 0 | 0 | 0 | 0 | 14 |
| MEX | 1 | 0 | 0 | 0 | 0 | 1 | 1 | 1 | 1 | 1 | 1 | 1 | 1 | 1 | 0 | 1 | 1 | 1 | 0 | 0 | 0 | 1 | 14 |
| PAK | 1 | 1 | 1 | 1 | 1 | 1 | 1 | 1 | 1 | 1 | 1 | 1 | 1 | 1 | 0 | 0 | 0 | 0 | 0 | 0 | 0 | 0 | 14 |
| CHN | 1 | 0 | 0 | 1 | 1 | 1 | 1 | 1 | 1 | 1 | 1 | 1 | 1 | 1 | 1 | 0 | 0 | 0 | 0 | 0 | 0 | 0 | 13 |
| KEN | 1 | 0 | 0 | 0 | 0 | 1 | 0 | 1 | 1 | 1 | 0 | 1 | 1 | 1 | 1 | 1 | 1 | 1 | 0 | 0 | 0 | 1 | 13 |
| ARG | 1 | 0 | 0 | 0 | 0 | 1 | 1 | 1 | 1 | 0 | 0 | 1 | 1 | 1 | 0 | 1 | 1 | 1 | 0 | 0 | 0 | 1 | 12 |
| AUS | 0 | 1 | 0 | 0 | 0 | 0 | 1 | 0 | 0 | 0 | 0 | 1 | 0 | 1 | 1 | 1 | 1 | 1 | 1 | 1 | 1 | 1 | 12 |
| ISR | 0 | 1 | 0 | 0 | 0 | 1 | 0 | 1 | 0 | 1 | 0 | 1 | 1 | 1 | 0 | 1 | 1 | 1 | 0 | 0 | 1 | 1 | 12 |
| ZAF | 1 | 0 | 0 | 0 | 0 | 1 | 1 | 0 | 0 | 0 | 0 | 1 | 1 | 1 | 1 | 1 | 1 | 1 | 0 | 0 | 0 | 1 | 11 |
| EGY | 1 | 0 | 0 | 0 | 1 | 1 | 1 | 1 | 1 | 1 | 1 | 1 | 1 | 0 | 0 | 0 | 0 | 0 | 0 | 0 | 0 | 0 | 10 |
| GRC | 0 | 0 | 0 | 0 | 0 | 0 | 0 | 0 | 0 | 0 | 1 | 1 | 1 | 0 | 1 | 1 | 1 | 1 | 0 | 1 | 1 | 1 | 10 |
| NLD | 0 | 0 | 0 | 1 | 0 | 0 | 0 | 0 | 0 | 0 | 0 | 0 | 0 | 0 | 1 | 1 | 1 | 1 | 1 | 1 | 1 | 1 | 9 |
| SWE | 0 | 0 | 0 | 0 | 0 | 1 | 0 | 0 | 0 | 0 | 0 | 0 | 0 | 0 | 1 | 1 | 1 | 1 | 1 | 1 | 1 | 1 | 9 |
| PHL | 1 | 0 | 0 | 0 | 0 | 0 | 0 | 0 | 0 | 0 | 0 | 1 | 1 | 1 | 0 | 1 | 1 | 1 | 0 | 0 | 0 | 0 | 7 |
| GHA | 1 | 0 | 0 | 0 | 0 | 1 | 0 | 0 | 0 | 0 | 0 | 1 | 1 | 1 | 0 | 1 | 0 | 0 | 0 | 0 | 0 | 0 | 6 |
| HUN | 0 | 0 | 0 | 0 | 0 | 0 | 0 | 0 | 0 | 0 | 0 | 0 | 0 | 0 | 1 | 1 | 1 | 1 | 0 | 0 | 1 | 1 | 6 |
| PSE | 0 | 1 | 0 | 0 | 0 | 1 | 0 | 1 | 0 | 1 | 0 | 1 | 0 | 1 | 0 | 0 | 0 | 0 | 0 | 0 | 0 | 0 | 6 |
| SEN | 1 | 0 | 0 | 0 | 0 | 1 | 0 | 0 | 0 | 0 | 0 | 1 | 1 | 1 | 0 | 1 | 0 | 0 | 0 | 0 | 0 | 0 | 6 |
| TUN | 0 | 0 | 0 | 0 | 0 | 0 | 0 | 0 | 0 | 0 | 1 | 1 | 1 | 0 | 0 | 1 | 1 | 1 | 0 | 0 | 0 | 0 | 6 |
| TZA | 1 | 0 | 0 | 0 | 0 | 1 | 1 | 0 | 0 | 0 | 0 | 0 | 1 | 1 | 0 | 1 | 0 | 0 | 0 | 0 | 0 | 0 | 6 |
| UKR | 1 | 0 | 0 | 0 | 0 | 1 | 0 | 0 | 0 | 1 | 0 | 0 | 1 | 1 | 0 | 0 | 0 | 1 | 0 | 0 | 0 | 0 | 6 |
| VEN | 1 | 0 | 0 | 0 | 0 | 1 | 0 | 0 | 0 | 0 | 0 | 1 | 1 | 1 | 0 | 1 | 0 | 0 | 0 | 0 | 0 | 0 | 6 |
| CHL | 0 | 0 | 0 | 0 | 0 | 1 | 0 | 0 | 0 | 0 | 0 | 1 | 1 | 1 | 0 | 1 | 0 | 0 | 0 | 0 | 0 | 0 | 5 |
| CZE | 1 | 0 | 0 | 0 | 0 | 1 | 0 | 0 | 0 | 0 | 1 | 1 | 0 | 0 | 0 | 0 | 0 | 1 | 0 | 0 | 0 | 0 | 5 |
| MYS | 0 | 0 | 0 | 0 | 0 | 1 | 0 | 0 | 0 | 0 | 0 | 1 | 1 | 1 | 0 | 0 | 0 | 0 | 0 | 0 | 1 | 0 | 5 |
| PER | 1 | 0 | 0 | 0 | 0 | 1 | 0 | 0 | 0 | 0 | 0 | 0 | 1 | 1 | 0 | 1 | 0 | 0 | 0 | 0 | 0 | 0 | 5 |
| UGA | 1 | 0 | 0 | 0 | 0 | 1 | 0 | 0 | 0 | 0 | 0 | 1 | 1 | 1 | 0 | 0 | 0 | 0 | 0 | 0 | 0 | 0 | 5 |
| MAR | 0 | 1 | 1 | 1 | 0 | 1 | 0 | 0 | 0 | 0 | 0 | 0 | 0 | 0 | 0 | 0 | 0 | 0 | 0 | 0 | 0 | 0 | 4 |
| VNM | 1 | 0 | 0 | 0 | 0 | 0 | 0 | 0 | 0 | 0 | 0 | 0 | 1 | 1 | 0 | 1 | 0 | 0 | 0 | 0 | 0 | 0 | 4 |
| BEL | 0 | 0 | 0 | 0 | 0 | 0 | 0 | 0 | 0 | 0 | 0 | 0 | 0 | 0 | 0 | 0 | 0 | 0 | 1 | 1 | 1 | 0 | 3 |
| BGD | 1 | 0 | 0 | 0 | 0 | 1 | 0 | 0 | 0 | 0 | 0 | 0 | 1 | 0 | 0 | 0 | 0 | 0 | 0 | 0 | 0 | 0 | 3 |
| BGR | 1 | 0 | 0 | 0 | 0 | 1 | 0 | 0 | 0 | 0 | 0 | 0 | 0 | 0 | 0 | 0 | 0 | 1 | 0 | 0 | 0 | 0 | 3 |
| BOL | 1 | 0 | 0 | 0 | 0 | 1 | 0 | 0 | 0 | 0 | 0 | 1 | 0 | 0 | 0 | 0 | 0 | 0 | 0 | 0 | 0 | 0 | 3 |
| SVK | 1 | 0 | 0 | 0 | 0 | 1 | 0 | 0 | 0 | 0 | 0 | 0 | 0 | 0 | 0 | 0 | 0 | 1 | 0 | 0 | 0 | 0 | 3 |
| CIV | 1 | 0 | 0 | 0 | 0 | 1 | 0 | 0 | 0 | 0 | 0 | 0 | 0 | 0 | 0 | 0 | 0 | 0 | 0 | 0 | 0 | 0 | 2 |
| COL | 0 | 0 | 0 | 0 | 0 | 0 | 0 | 0 | 0 | 0 | 0 | 0 | 1 | 0 | 0 | 1 | 0 | 0 | 0 | 0 | 0 | 0 | 2 |
| ETH | 0 | 0 | 0 | 0 | 0 | 1 | 0 | 0 | 0 | 0 | 0 | 0 | 0 | 1 | 0 | 0 | 0 | 0 | 0 | 0 | 0 | 0 | 2 |
| KWT | 0 | 1 | 0 | 0 | 0 | 1 | 0 | 0 | 0 | 0 | 0 | 0 | 0 | 0 | 0 | 0 | 0 | 0 | 0 | 0 | 0 | 0 | 2 |
| LTU | 0 | 0 | 0 | 0 | 0 | 0 | 0 | 0 | 0 | 1 | 0 | 0 | 0 | 0 | 0 | 0 | 0 | 1 | 0 | 0 | 0 | 0 | 2 |
| MLI | 1 | 0 | 0 | 0 | 0 | 1 | 0 | 0 | 0 | 0 | 0 | 0 | 0 | 0 | 0 | 0 | 0 | 0 | 0 | 0 | 0 | 0 | 2 |
| SGP | 0 | 0 | 0 | 0 | 0 | 0 | 0 | 0 | 0 | 0 | 0 | 0 | 0 | 0 | 0 | 0 | 0 | 0 | 0 | 1 | 1 | 0 | 2 |
| SLV | 0 | 0 | 0 | 0 | 0 | 0 | 0 | 0 | 0 | 0 | 0 | 1 | 1 | 0 | 0 | 0 | 0 | 0 | 0 | 0 | 0 | 0 | 2 |
| AGO | 1 | 0 | 0 | 0 | 0 | 0 | 0 | 0 | 0 | 0 | 0 | 0 | 0 | 0 | 0 | 0 | 0 | 0 | 0 | 0 | 0 | 0 | 1 |
| BFA | 0 | 0 | 0 | 0 | 0 | 0 | 0 | 0 | 0 | 0 | 0 | 0 | 0 | 1 | 0 | 0 | 0 | 0 | 0 | 0 | 0 | 0 | 1 |
| DNK | 0 | 0 | 0 | 0 | 0 | 0 | 0 | 0 | 0 | 0 | 0 | 0 | 0 | 0 | 0 | 0 | 0 | 0 | 1 | 0 | 0 | 0 | 1 |
| GTM | 1 | 0 | 0 | 0 | 0 | 0 | 0 | 0 | 0 | 0 | 0 | 0 | 0 | 0 | 0 | 0 | 0 | 0 | 0 | 0 | 0 | 0 | 1 |
| HND | 1 | 0 | 0 | 0 | 0 | 0 | 0 | 0 | 0 | 0 | 0 | 0 | 0 | 0 | 0 | 0 | 0 | 0 | 0 | 0 | 0 | 0 | 1 |
| NIC | 0 | 0 | 0 | 0 | 0 | 0 | 0 | 0 | 0 | 0 | 0 | 0 | 1 | 0 | 0 | 0 | 0 | 0 | 0 | 0 | 0 | 0 | 1 |
| NZL | 0 | 0 | 0 | 0 | 0 | 0 | 0 | 0 | 0 | 0 | 0 | 0 | 0 | 0 | 0 | 0 | 0 | 0 | 0 | 1 | 0 | 0 | 1 |
| PLS | 0 | 0 | 0 | 0 | 0 | 0 | 0 | 0 | 0 | 0 | 0 | 0 | 1 | 0 | 0 | 0 | 0 | 0 | 0 | 0 | 0 | 0 | 1 |
| THA | 0 | 0 | 0 | 0 | 0 | 0 | 0 | 0 | 0 | 0 | 0 | 0 | 1 | 0 | 0 | 0 | 0 | 0 | 0 | 0 | 0 | 0 | 1 |
| TWN | 0 | 0 | 0 | 0 | 0 | 0 | 0 | 0 | 0 | 0 | 0 | 0 | 0 | 0 | 0 | 0 | 0 | 0 | 0 | 1 | 0 | 0 | 1 |
| UZB | 1 | 0 | 0 | 0 | 0 | 0 | 0 | 0 | 0 | 0 | 0 | 0 | 0 | 0 | 0 | 0 | 0 | 0 | 0 | 0 | 0 | 0 | 1 |
These table deserve a lot of comment as it reveals at the same time (1) the evolution of choices made by the PGAS in their coverage of the world opinion, but also (2) the geopolitical constraints that made possible or not the realization of the survey in the target countries. Just a few examples, before a more precise investigation :
The countries that has been the most present in the 22 waves are members of “the Western” (Germany, France, UK, Spain, Japan, Poland) and can be considered as “friends” of the US. The US themselves has not been investogated in the final period 2021-2023, probably because the questions asked in PGAS are also asked in other national surveys of the Pew Research Center (PRC). It is certainly possible to find the data for these years elsewhere on the website of the PRC.
Russia has been systematically investigated from 2002 to 2015 but not in 2016. Then present again in 2017-2019 but not after. We can imagine that the possibility to realize surveys in Russia became more difficult after the first war of Ukraine (2014) and impossible with the beginning of the Covid crisis (2020)
China was investigated in 2002 and in 2005-2016 but never after this period of time. As in the case of Russia, we can imagine that it became difficult and finally impossible to realize surveys in these country after the designation of Xi Jiping as head of state in 2013.
In the ‘South’, the coverage is much more important for large emerging countries (Indian Indonesia, Turkey, Brazil, …) than smaller one.
Africa is less covered than Middle-East
etc.
From statistical point of view we should just keep in the moment that the survey has been realized at least one time in 70 countries of the world. But only a minority of them are likely to be used for the analysis of trends over long period of time.
Map of spatial coverage
To offer a better idea of the geographical selection of countries made by the PGAS, it is interesting to propose a map, describing the countries that has been covered or not and the number of waves where they was present.
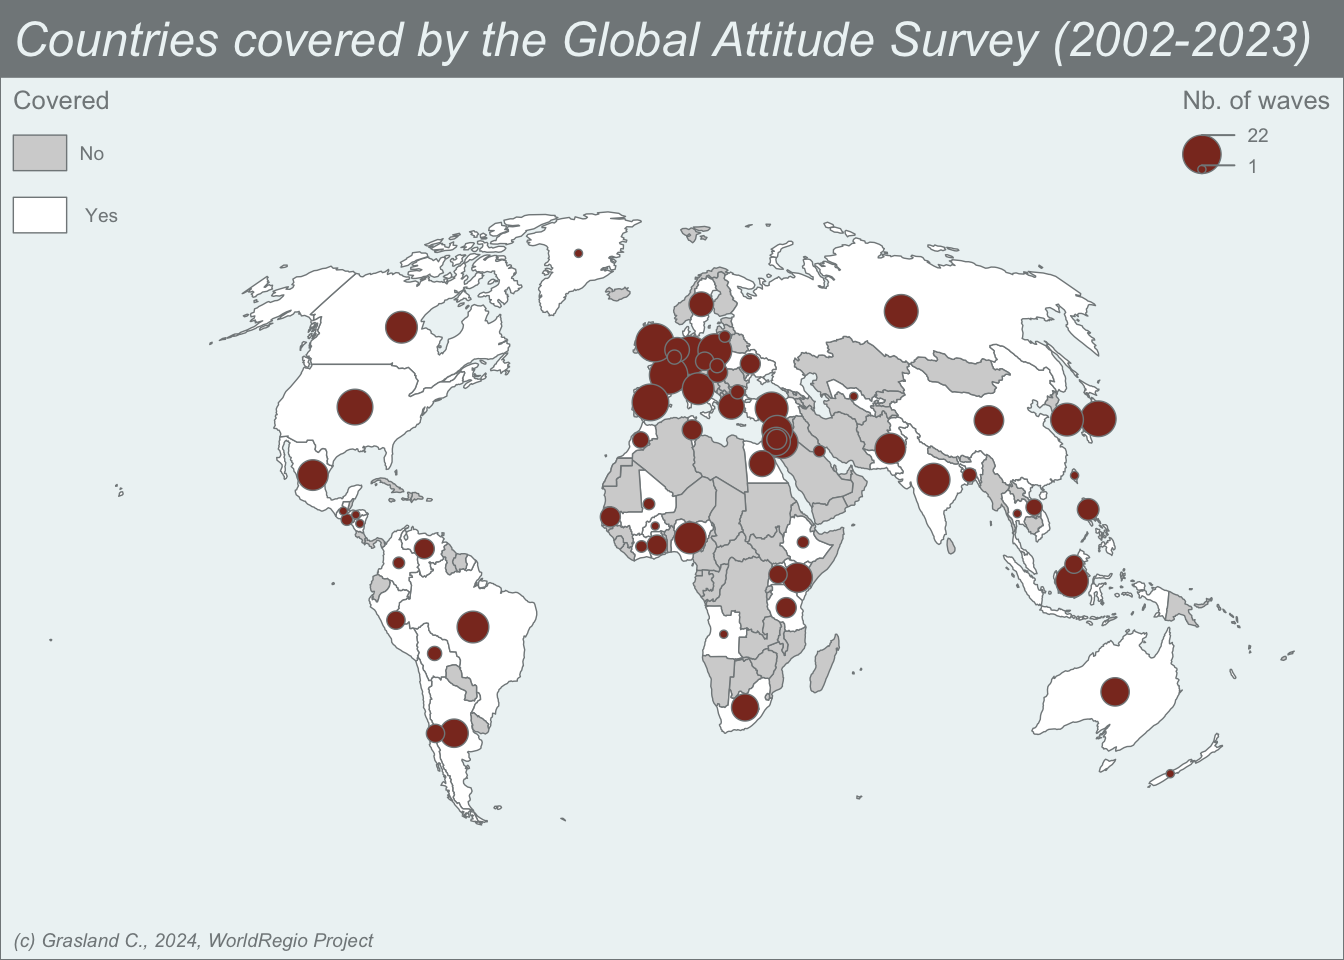
Looking at the map, it appears very clearly an uneven spatial distribution with very spare coverage in Africa or central Asia as compared to Americas, Europa and Southern or Eastern Asia. The PGAS will therefore not offer a perfect basis for the analysis of the evolution of global opinion in the world. But it makes nevertheless possible to explore some great tendencies in all part of the worlds between 2002 and 2023.
Conclusion
The core period of interest is 2007-2019
Looking at the availability of data by indicator and by survey, it appears clearly that the most favorable period of observation for the analysis of opinion dynamics is 2007-2019. In 2002-2006, many indicators was not avaiblable or many countries of interest was missing. And in 2020-23, the covid crisis and the increase of geopolitical conflicts between “North” and “South” has limited the possibilities to launch surveys in countries of major interest like China or Russia.
The most interesting opinions are about USA, China, Russia, EU and UN
Now, considering the distribution of opinions at different periods of time and in different samples of countries, it appears that only USA, China and Russia are covered on a long period, eventually completed by EU and UN. The opinions about other countries (Germany, France, Japan, India, …) are only been asked to all countries in some waves. We could eventually add some information in the case of waves where the opinion of this countries has been asked to subsamples. But we prefer to exclud this partial informations.