| wav | sta | wgt | sex | age | opi_rel | opi_USA | opi_CHN | opi_RUS | opi_UN | opi_EU | opi_IRN | opi_DEU | opi_FRA | opi_JPN | opi_IND | opi_TWN | opi_BRA | |
|---|---|---|---|---|---|---|---|---|---|---|---|---|---|---|---|---|---|---|
| 617342 | 2023 | ZAF | 1.0502763 | Male | 24 | Somewhat important | Somewhat favorable | Very favorable | Somewhat favorable | Somewhat favorable | Somewhat favorable | NA | NA | NA | NA | Somewhat favorable | Somewhat favorable | NA |
| 617343 | 2023 | ZAF | 0.3254254 | Male | 39 | Very important | Very unfavorable | Very unfavorable | Very unfavorable | Very unfavorable | Very unfavorable | NA | NA | NA | NA | Very unfavorable | DK | NA |
| 617344 | 2023 | ZAF | 2.4937630 | Male | 28 | Very important | DK | Very unfavorable | Very unfavorable | DK | Very unfavorable | NA | NA | NA | NA | Somewhat favorable | DK | NA |
| 617345 | 2023 | ZAF | 0.7725435 | Female | 24 | Very important | Somewhat favorable | Somewhat favorable | Somewhat favorable | Somewhat favorable | Somewhat favorable | NA | NA | NA | NA | Somewhat favorable | Somewhat favorable | NA |
Modelisation of global opinion
Comparison of opinions on USA, China, Russia and EU (2002-2023)
We have presented in a previous post the database that we have elaborated on the basis of the Global Attitude Survey in order to follow the evolution of world opinion about the three major powers that are USA, China and Russia.
We remind briefly the structure of the database of 617345 observation and 18 variables.
Data preparation
In order to have a better formalisation of the data, we will transform the database in a multidimensional structure where each opinion will be describe by a single variable \(O_{ijt}\) where :
- \(O\) is an opinion measured on a Likert scale with 4 levels (“Very favorable”, “Almost favorable”, “Almost unfavorable”,“Very Unfavorable”)
- \(i\) is the origin of the opinion (i.e. the place of survey where the opinion has been collected)
- \(j\) is the target of the opinion (i.e. the country or organisation that was evaluated). We limit here the value to three case that are USA, China and Russia.
- \(t\) the time period (i.e. wave of survey) of collection of the opinion.
The database is eventually completed by two structural parameter describing the age \(A_{it}\) and the sex \(S_{it}\) of the person who has formulated the opinion.
We can eventually cross the results with another variable \(R_{it}\) describing the opinion on religion using another Likert scale with 4 levels.
Lest but not least each sample collected in a country i a t time t is associated with a weigthing criteria \(W_{it}\) that insure a better representation of the full population.
We transform Oijt in a boolean variable Fijt related to favorable opinion and we eliminate people without opinion
| Origin (i) | Target (j) | Time (t) | Weight(ijt) | Favorable opinion (Fijt) |
|---|---|---|---|---|
| AGO | USA | 2002 | 0.422 | TRUE |
| AGO | USA | 2002 | 0.422 | TRUE |
| AGO | USA | 2002 | 0.422 | TRUE |
| AGO | USA | 2002 | 0.422 | TRUE |
| AGO | USA | 2002 | 2.037 | TRUE |
| AGO | USA | 2002 | 0.411 | TRUE |
We can now examine different marginal models describing the effects of the dimensions \(i,j,t\) and their combination.
Opinion from origin countries (i)
We can firstly analyze if some countries are more likely than others to provide positive opinions to our three target countries.
\(log \frac{p}{1-p} = \alpha + \beta_i.Origin_i\)
Analysis of Deviance Table (Type II tests)

Response: Fijt
  LR Chisq Df Pr(>Chisq)
i   100660 69  < 2.2e-16 ***
---
Signif. codes:  0 '***' 0.001 '**' 0.01 '*' 0.05 '.' 0.1 ' ' 1
We obtain a list of coefficients that indicates the country that are the most likely to provide favorable opinion, whatever the target country.
- Comment : we observe a fascinating economic and geographic division between countries that provide generally postive opinion (poor or african, …) and countries that are more likely to provide negativ opinion (rich or middle east ). Of course this result has to be confirmed because the countries has not been surveyed at the same period of time but we keep this result in mind
Opinion about target countries (j)
We can analyze ow the variations of opinion of our target countries
\(log \frac{p}{1-p} = \alpha + \gamma_j.target_j\)
        j   Fijt      n
   <char> <lgcl>  <num>
1:    USA   TRUE 329492
2:    USA  FALSE 234351
3:    RUS   TRUE 163829
4:    RUS  FALSE 219425
5:    CHN  FALSE 218949
6:    CHN   TRUE 276193
Analysis of Deviance Table (Type II tests)
Response: Fijt
LR Chisq Df Pr(>Chisq)
j 32941 3 < 2.2e-16 ***
---
Signif. codes: 0 '***' 0.001 '**' 0.01 '*' 0.05 '.' 0.1 ' ' 1We obtain a list of coefficients that indicates the target countries that are the most likely to receive favorable opinion, whatever the country of origin.
| j | beta_j |
|---|---|
| EUR | 0.2750832 |
| CHN | 0.2322611 |
| USA | 0.1084710 |
| RUS | -0.5244484 |
- Comment : Without control on the time period or the countries of origin, we can say that the most positive opinion is received by EU, followed by China and US. Russia is clearly the target country that has received the most negative opinion over the period of observation.
Opinions through time (t)
Without considering origin or target countries anymore, do we observe trends in the expression of positive opinion over time ?
\(log \frac{p}{1-p} = \alpha + \delta_t.time_t\)
We can firstly analyze if some countries are more likely than others to provide positive opinions to our three target countries.
Analysis of Deviance Table (Type II tests)

Response: Fijt
  LR Chisq Df Pr(>Chisq)
t    19349 21  < 2.2e-16 ***
---
Signif. codes:  0 '***' 0.001 '**' 0.01 '*' 0.05 '.' 0.1 ' ' 1
We obtain a list of coefficients that indicates the country that are the most likely to provide favorable opinion, whatever the target country.
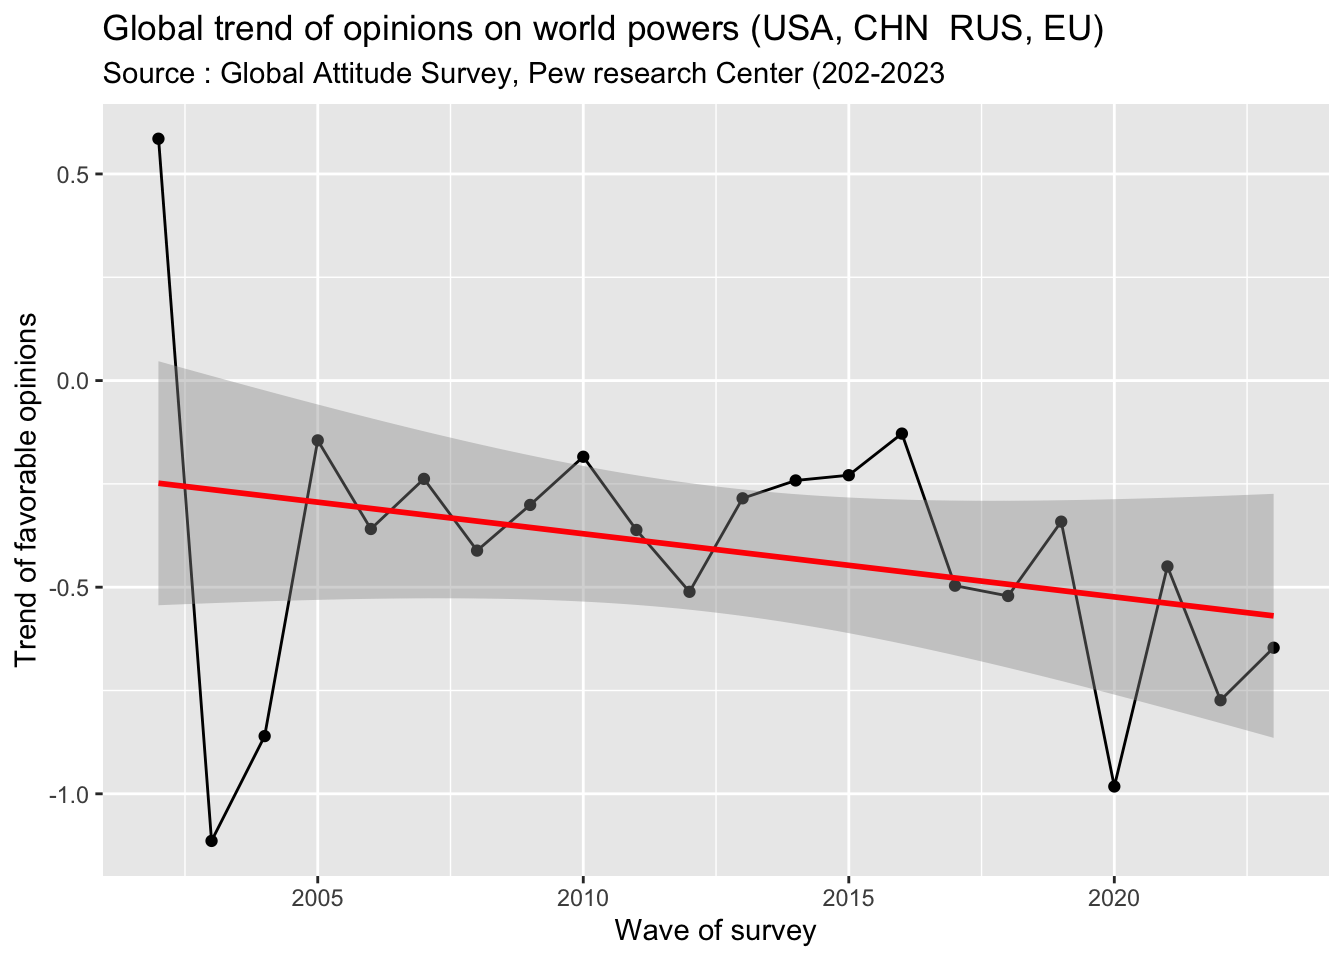
- Comment : if we exclude the chaotic variation of the beginning period 2002-2004, we can notice a clear trend of decline of the share of positive opinion about the four world powers that we have selected. But as in the previous analysis we can not exclude here an effect of selection of origin and target countries in the different waves.
Joint analysis of marginal effects (i,j,t)
We can obtain more accurate evaluation by introducing all marginal effects together in order to control their relative influences on the results.
\(log \frac{p}{1-p} = \alpha + \beta_i.origin_i + \gamma_j.target_j + \delta_t.time_t\)
Analysis of Deviance Table (Type II tests)

Response: Fijt
  LR Chisq Df Pr(>Chisq)
i    93685 69  < 2.2e-16 ***
j    36039  3  < 2.2e-16 ***
t     9754 21  < 2.2e-16 ***
---
Signif. codes:  0 '***' 0.001 '**' 0.01 '*' 0.05 '.' 0.1 ' ' 1
This does not really modify the results presented above but introduce some corrections.
Evolution of opinion on target countries
\(log \frac{p}{1-p} = \alpha + \beta_i.origin_i + \phi_{jt}.[target\times time]_{jt}\)
Analysis of Deviance Table (Type II tests)

Response: Fijt
    LR Chisq Df Pr(>Chisq)
i      93992 69  < 2.2e-16 ***
j:t    89531 67  < 2.2e-16 ***
---
Signif. codes:  0 '***' 0.001 '**' 0.01 '*' 0.05 '.' 0.1 ' ' 1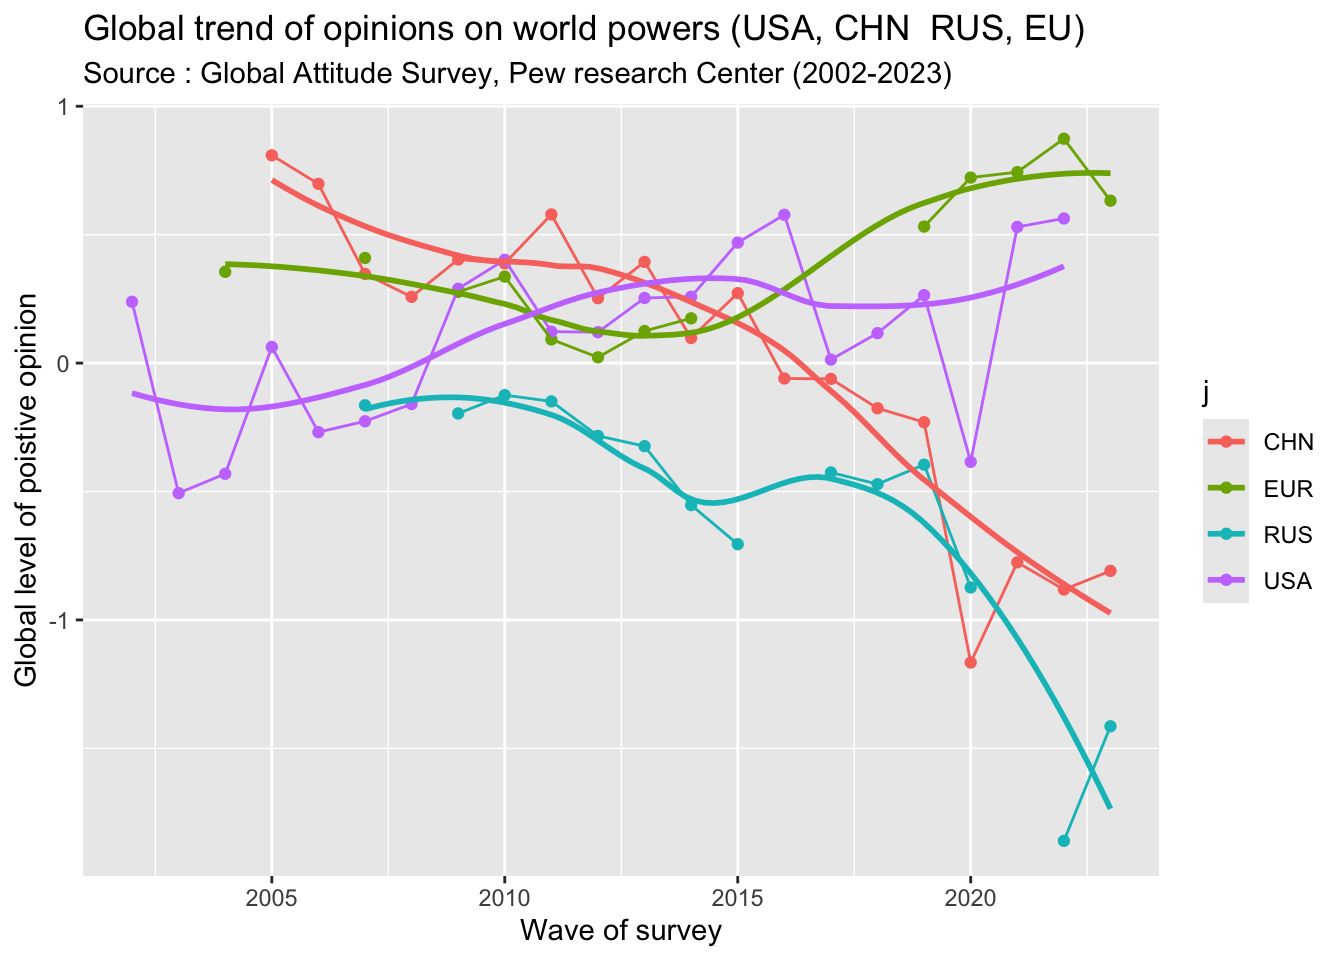
- Comment : After elimination of the variations related to countries of origin, we obtain comparative parameter of appreciations of world powers at different period of time and we can draw tendencies through interpolation by loess method. What appears clearly in the figure is a recent divergence between US and European Union on the one hand, China and Russia on the other hand. More precisely :
- European Union has maintained a good level of appreciation during all the period with apparentlyan increase between 2014 and 2019-23, but difficult to validate because lack of data.
- USA has experimented a more chaotic trend with ups and downs in relation with the different presidents. But has a whole the general trend appears to be positive during the period.
- China had initially an excellent position and was the most appreciated world power in 2005-2006 and also 2009-2013. But this favorable appreciation declined regularly and especially in 2020 , probably in relation with the covid crisis.
- Russia has the same appreciation than USA in 2007-2008 and remained stable with just a slow decline in 2015. But the decrease was very strong after 2019 and the lowest level was reached in 2022-23 with the second war in Ukraine.
Average opinion of origin countries on target countries
\(log \frac{p}{1-p} = \alpha + \delta_t.time_t + \tau_{jt}.[origin\times target]_{ij}\)
We try here to evaluate the global attraction/repulsion of survey countries about target powers over the whole period of investigation. We introduce just a control of the time (t) before to extract the parameter i:j which measure an average opinion on the four world powers. We elimlinate the survey countries that has not formulated an opinion on all the four powers. We eliminate also USA, China and Russia.
Analysis of Deviance Table (Type II tests)
Response: Fijt
LR Chisq Df Pr(>Chisq)
t 9799 21 < 2.2e-16 ***
i:j 269980 264 < 2.2e-16 ***
---
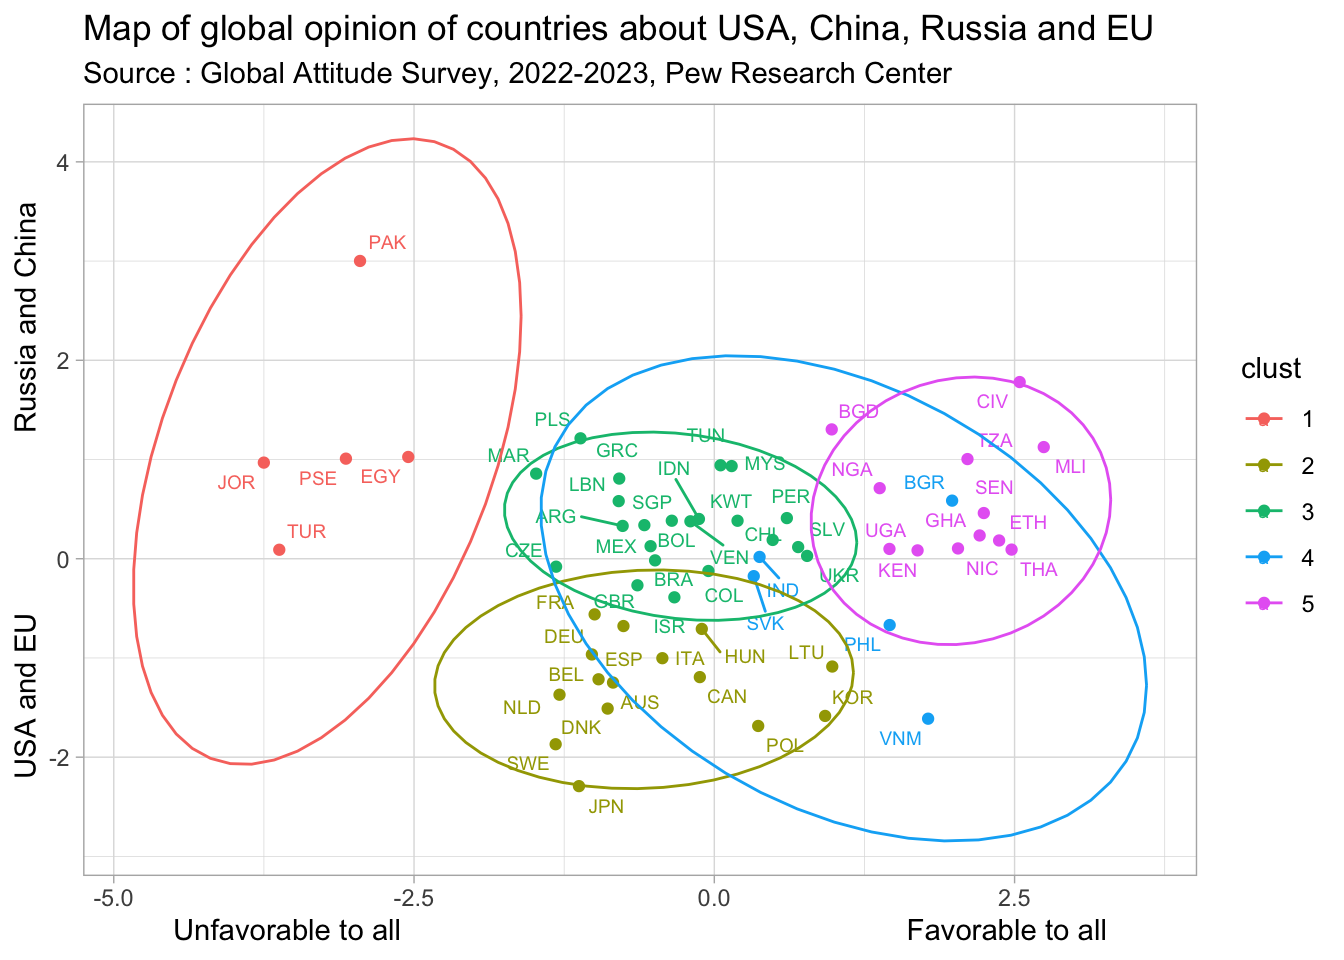
Signif. codes: 0 '***' 0.001 '**' 0.01 '*' 0.05 '.' 0.1 ' ' 1We proceed then to a Principal Component Analysis in order to evaluate the structure obtained.
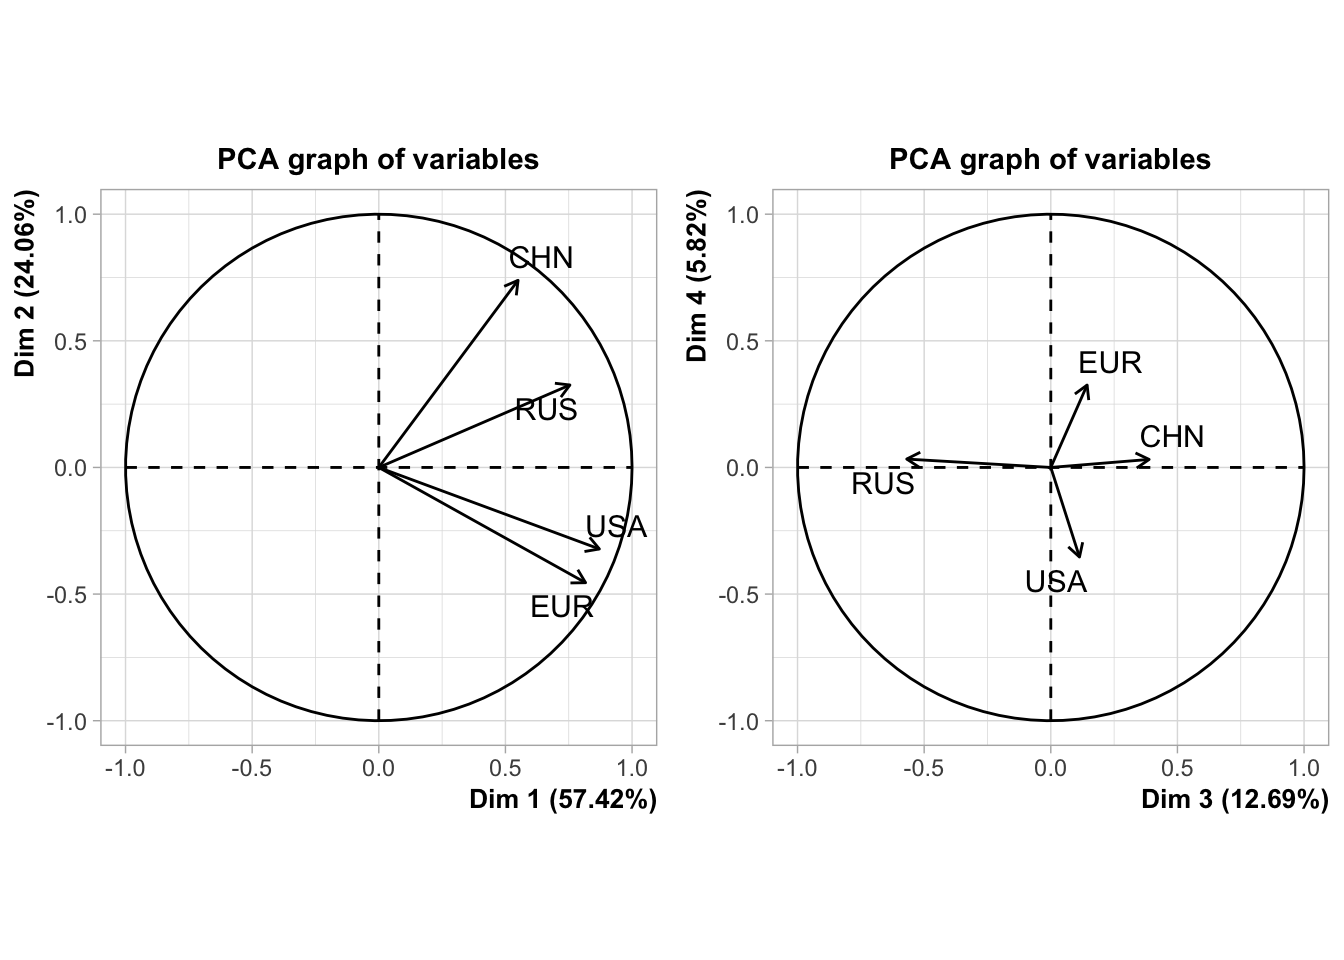
We notice that the two first dimension summarize more than 80% of the information and only minor details are collected by dimension three and four.
- Dim1 reveals a general opinion on the four world powers that can be generally positive (right) or generally negative (left).
- Dim2 reveals a polarisation between the ‘Western and the Rest’ or, said differently, between ‘Global North and Global South’. Countries located on the top are more favorable to Russia and China than to the US and EU. Countries on the bottom are characterized by the opposite.
- Dim3 characterized specific situations of dissociation between preferences for China and Russia that can for example happen in the case of Vietnam.
- Dim4 characterized excpetional cases of dissociation between preferences for US and Europe that can for example happen in the case of UK.
We can now examine the position of survey countries on these different dimensions. But we can firstly proceed to a hieararchical clustering in order to discuss the position of group of countries rather than single ones. We obtain clearly five group of countries with characteristic profiles.
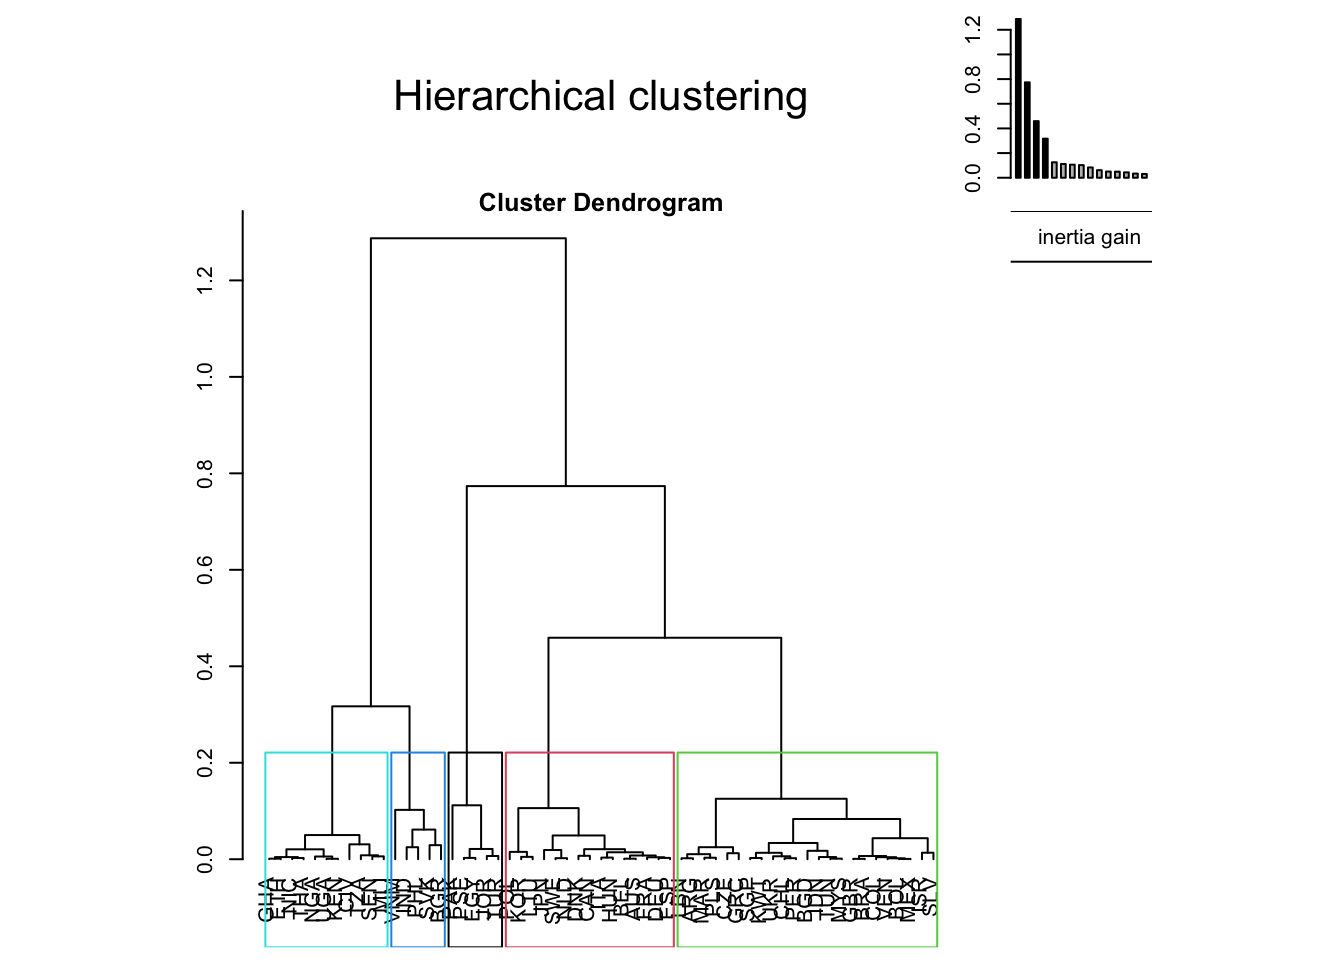
- Cluster 1 is characterized by a very negative opinion about USA and EU and a negative opinion about Russia. Only China is characterized by an average opinion comparable to the rest of the world. The countries member of this cluster are typically arabic countries from Middle East (Egypt, Jordan, Pakistan, Occupied Palestinian Territories, Turkey)
| v.test | Mean in category | Overall mean | sd in category | Overall sd | p.value | |
|---|---|---|---|---|---|---|
| CHN | -0.679 | -0.658 | -0.398 | 1.012 | 0.888 | 0.497 |
| RUS | -2.528 | -1.799 | -1.045 | 0.264 | 0.691 | 0.011 |
| EUR | -5.223 | -1.690 | -0.048 | 0.340 | 0.728 | 0.000 |
| USA | -5.339 | -2.416 | -0.336 | 0.129 | 0.903 | 0.000 |
- Cluster 2 is characterized by a positive opinion of EU, a neutral opinon on USA and a very negative opinion of Russia and China. This situation is typically observed in countries member of the EU but rather from western and northern part (France, Germany, Belgium, Sweden) but also other OECD countries (Japan, Korea, Canada, Australia, …)
| v.test | Mean in category | Overall mean | sd in category | Overall sd | p.value | |
|---|---|---|---|---|---|---|
| EUR | 2.188 | 0.310 | -0.048 | 0.372 | 0.728 | 0.029 |
| USA | 0.252 | -0.285 | -0.336 | 0.470 | 0.903 | 0.801 |
| RUS | -4.121 | -1.686 | -1.045 | 0.376 | 0.691 | 0.000 |
| CHN | -4.193 | -1.235 | -0.398 | 0.384 | 0.888 | 0.000 |
- Cluster 3 is generally characterized by an average profile. More precisely it is characterized by neutral opinion of Russia, slighltly negative opinion on USA, slightly positive opinion on China and more negative opinion on European Union than in the rest of the sample. This situation corresponds to a large cluster of emerging countries located all around the world, including european countries from southern and eastern Europe like (Greece, Slovenia, Czech Republic, …). UK is member of this group as well as Israel.
| v.test | Mean in category | Overall mean | sd in category | Overall sd | p.value | |
|---|---|---|---|---|---|---|
| CHN | 0.850 | -0.269 | -0.398 | 0.378 | 0.888 | 0.395 |
| RUS | -0.303 | -1.080 | -1.045 | 0.267 | 0.691 | 0.762 |
| USA | -1.108 | -0.507 | -0.336 | 0.586 | 0.903 | 0.268 |
| EUR | -2.393 | -0.345 | -0.048 | 0.356 | 0.728 | 0.017 |
- Cluster 4 is a very specific case of countries having a much more positive opinion on Russia than usual, a rather positive opinion on USA and a rather negative opinion on China. Countries located in this group are european countries with good relations with Russia (Bulgaria, Slovakia) or asian countries characterized by negative relation with China, generally due to border conflicts (India, Vietnam, Philippines).
| v.test | Mean in category | Overall mean | sd in category | Overall sd | p.value | |
|---|---|---|---|---|---|---|
| RUS | 4.022 | 0.155 | -1.045 | 0.583 | 0.691 | 0.000 |
| USA | 1.438 | 0.224 | -0.336 | 0.678 | 0.903 | 0.150 |
| EUR | 0.979 | 0.260 | -0.048 | 0.493 | 0.728 | 0.327 |
| CHN | -1.683 | -1.043 | -0.398 | 0.813 | 0.888 | 0.092 |
- Cluster 5 is the complete opposite of Cluster 1 and is characterized by very positive opinion about all the world powers without distinction. This situation is typically associated to all countries from sub-saharan Africa present in the surveys (Ivory Coast, Ethiopia, Ghana, …) but also some other poor and developping countries (Bangladesh, Nicaragua, Thailand)
| v.test | Mean in category | Overall mean | sd in category | Overall sd | p.value | |
|---|---|---|---|---|---|---|
| CHN | 5.149 | 0.791 | -0.398 | 0.459 | 0.888 | 0.000 |
| RUS | 3.788 | -0.364 | -1.045 | 0.237 | 0.691 | 0.000 |
| USA | 3.757 | 0.545 | -0.336 | 0.370 | 0.903 | 0.000 |
| EUR | 3.445 | 0.604 | -0.048 | 0.380 | 0.728 | 0.001 |
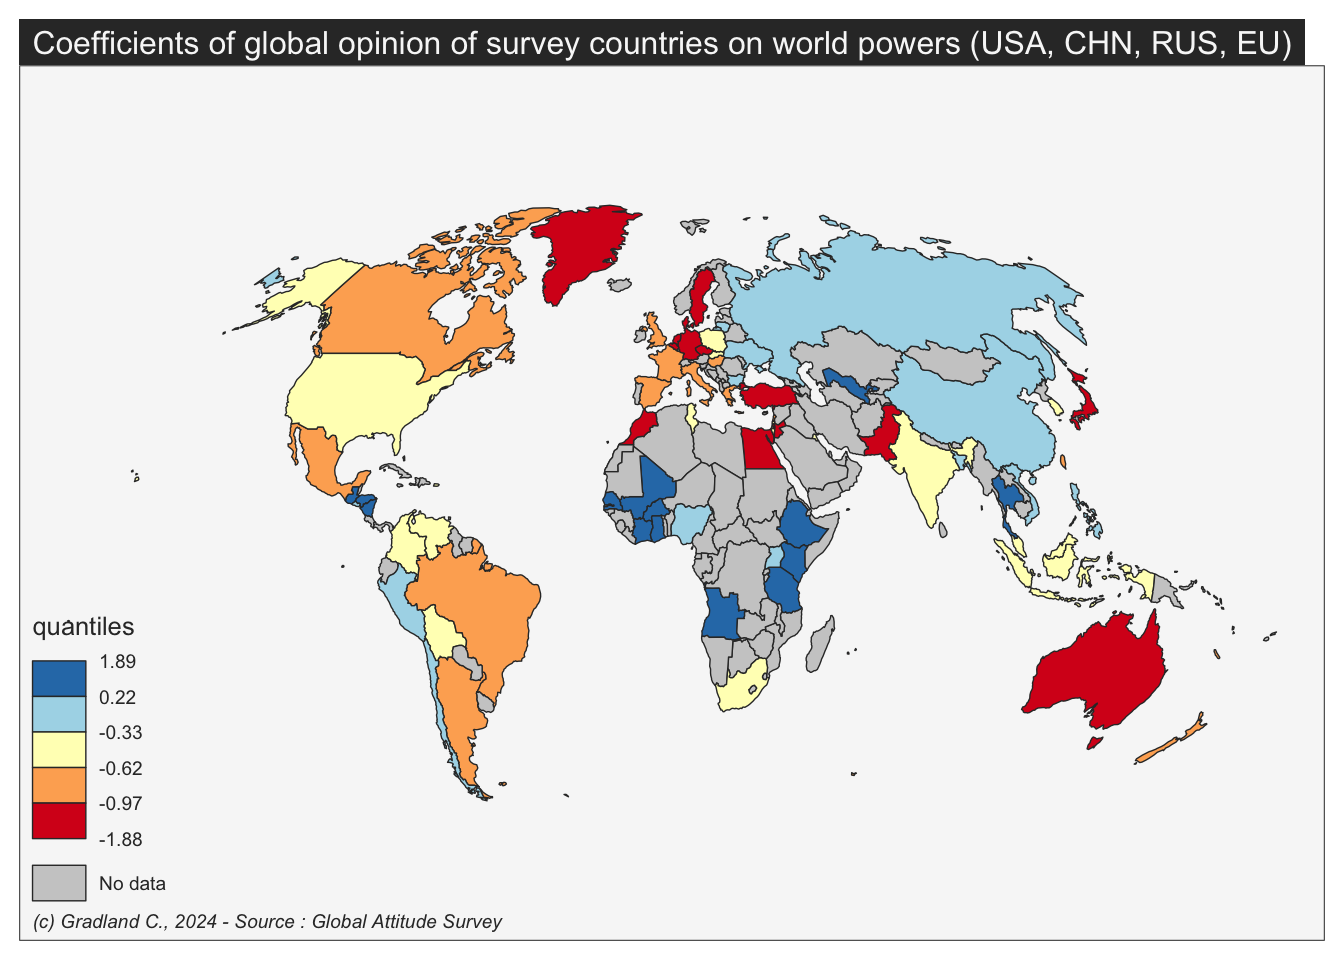
We can finally elabore a geopolitical map of countries opinion about the major world power over the period 2002-2023